
# libraries
library(data.table)Here, I simulate a species co-occurrence problem using only base R and R package data.table.
Simulation
Observed co-occurrence can be compared to the expected co-occurrence where the latter is the product of the two species’ probability of occurrence multiplied by the number of sampling sites: \(E(N_{1,2}) = P(1) \times P(2) \times N\).
# number of sampling sites (N)
N <- 1000

# probability of encountering species 1
P1 <- 0.3

# probability of encountering species 2
P2 <- 0.1

# expected number of sites where they co-occur
N_12 <- P1 * P2 * N

# print result
print(N_12)
[1] 30It can be easier to understand this using a simulation:
# repeat simulation n times
n <- 10000

# sites & simulation number
s <- data.table("site" = rep(1:N, n),
                "simulation" = rep(1:n, each = N))

# add species 1 occurrences
s[, `species 1` := sample(c(0, 1), size = N * n, replace = TRUE, prob = c(1 - P1, P1))]

# add species 2 occurrences
s[, `species 2` := sample(c(0, 1), size = N * n, replace = TRUE, prob = c(1 - P2, P2))]

# add coocurrence
s[, `expct cooccur` := as.numeric((`species 1` + `species 2`) == 2)]
print(s)
site simulation species 1 species 2 expct cooccur
1: 1 1 0 0 0
2: 2 1 1 0 0
3: 3 1 0 0 0
4: 4 1 0 1 0
5: 5 1 0 0 0
---
9999996: 996 10000 1 0 0
9999997: 997 10000 1 0 0
9999998: 998 10000 1 0 0
9999999: 999 10000 0 0 0
10000000: 1000 10000 0 0 0# number of times the cooccur on average, i.e., expectation
expct <- s[, .(c = sum(`expct cooccur`)),
by = simulation][, .(Expectation = mean(c))]
# print result
print(expct) Expectation
1: 29.9796Let us assume that we observe these species co-occurring at 35 sites. How likely is it that this is more often than expected by chance?
# number cooccurrences
l <- 35

# observed coocurrences
o <- do.call("rbind",
             list(matrix(rep(c(1, 1), l),
                         ncol = 2, byrow = TRUE),
                  matrix(rep(c(1, 0), (N * P1) - l),
                         ncol = 2, byrow = TRUE),
                  matrix(rep(c(0, 1), (N * P2) - l),
                         ncol = 2, byrow = TRUE),
                  matrix(rep(c(0, 0), N - (l + ((N * P1) - l) + ((N * P2) - l))),
                         ncol = 2, byrow = TRUE)))

# add to simulations
s[, `obsrv cooccur` := rep(as.numeric(rowSums(o) == 2), n)]

# how often is expct <= obsrv?
p <- s[, sum(`obsrv cooccur`) <= sum(`expct cooccur`),
       by = simulation][, .(n = sum(V1), p = mean(V1))]

# print result
print(p)
n p
1: 1941 0.1941We can show this on a histogram of the number of co-occurrences in the simulations with the actual number of co-occurrences shown in red.
# plot histogram
foo <- s[, .(c = sum(`expct cooccur`)),
       by = simulation]$c
hist(foo,
     main = "Histogram of simulated number of co-occurrences",
     xlab = "Number of co-occurrences",
     xlim = c(min(foo), max(c(max(foo, l)) + 10)))
abline(v = l, col = "red", lwd = 3)
mtext(paste0("p = ", p$p),
      side = 3, line = 0, at = l, col = "red")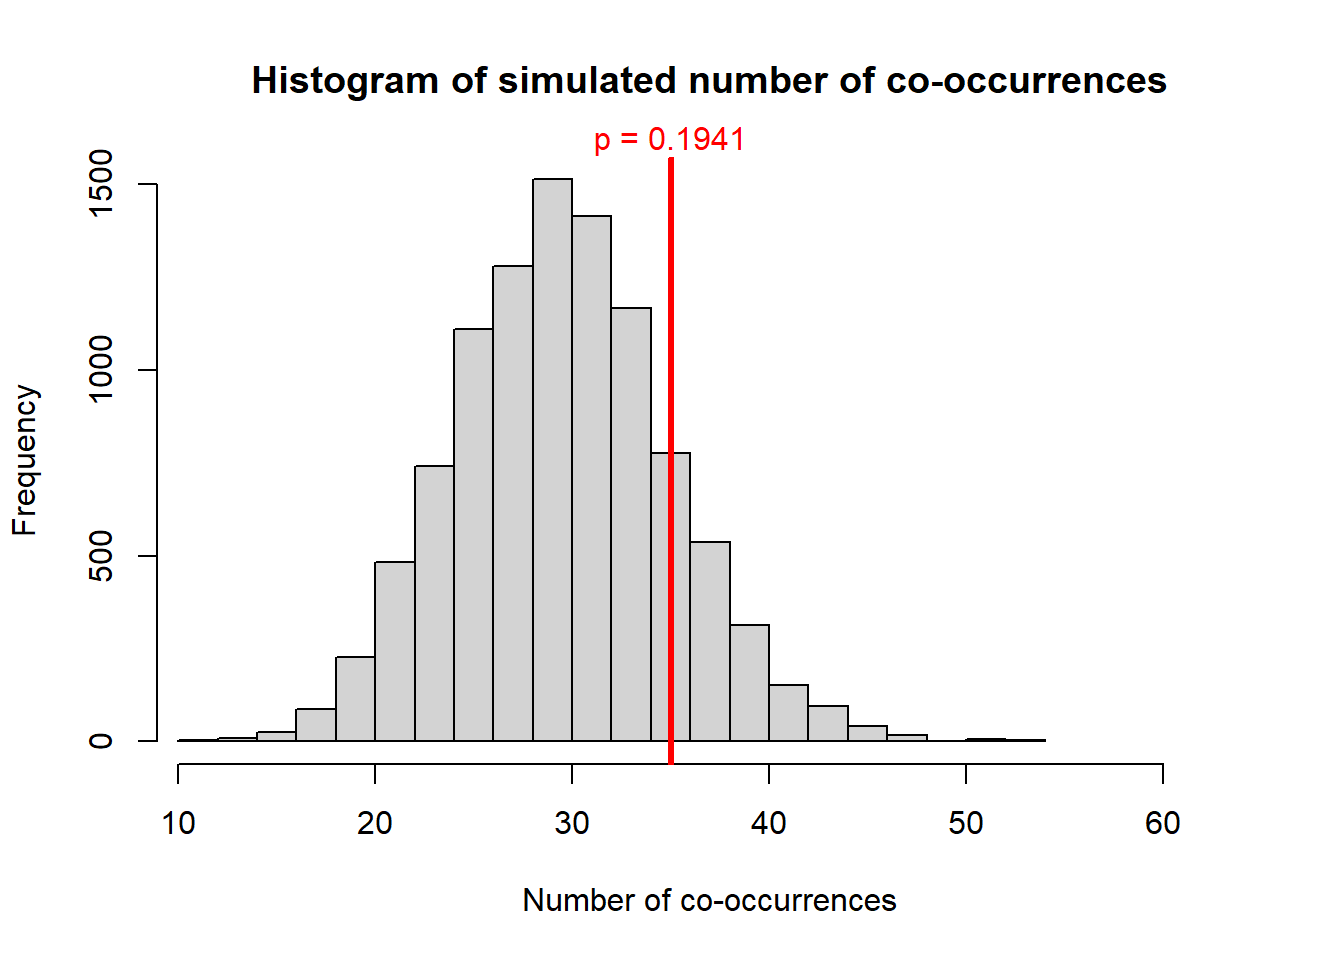
What if!???
Thanks to Robert Thorpe for an interesting question:
“If P1 and P2 both decreased by 50%, e.g., if there was an unproductive year in the ecosystem, the co-occurrence expected would go down by 75% other things being equal?”
# number of sampling sites (N) - same
N <- 1000

# probability of encountering species 1 - 50% lower
P1 <- 0.3 * 0.5

# probability of encountering species 2 - 50% lower
P2 <- 0.1 * 0.5

# expected number of sites where they co-occur
N_12 <- P1 * P2 * N

# print result
print(N_12)
[1] 7.5which should be the same as 75% fewer coocurrences:
# check
30 * (1 - 0.75)
[1] 7.5Reading
This can be done more efficiently using a combinatorial approach: see https://thatdarndata.com/understanding-species-co-occurrence/
R package
cooccuruses a probabilistic approximation to the combinatorial approach and is still faster
Reuse
Citation
BibTeX citation:
@online{d. gregory2023,
  author = {D. Gregory, Stephen},
  title = {Understanding Co-Occurrence},
  date = {2023-02-09},
  url = {https://stephendavidgregory.github.io/posts/coocurrence},
  langid = {en}
}
For attribution, please cite this work as:
D. Gregory, Stephen. 2023. “Understanding Co-Occurrence.”
February 9, 2023. https://stephendavidgregory.github.io/posts/coocurrence.